



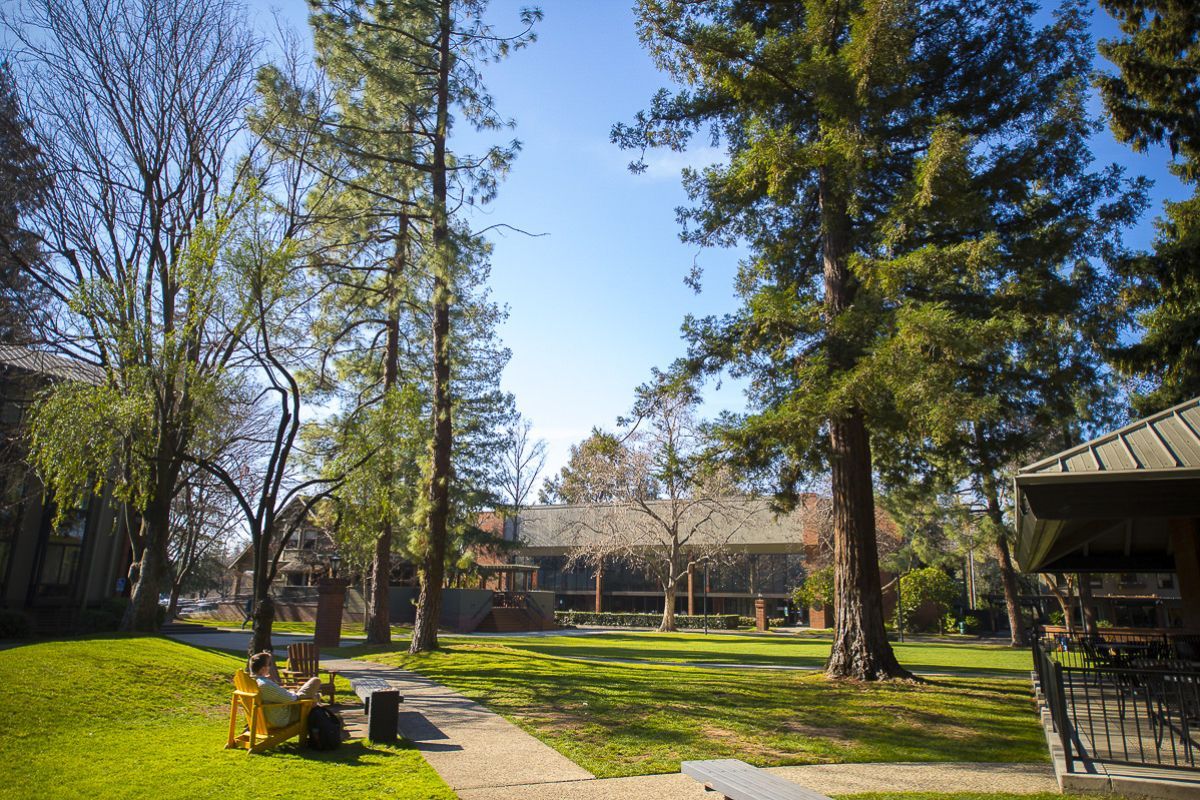
Who are McGeorge students? Highly intelligent, hardworking and fun-loving people like you! Our student body is increasingly diverse and engaged, bringing to the McGeorge community a host of perspectives and talents from a variety of undergraduate programs and careers from around the globe.
Fall 2026 Class Profile1
Combined | Full-time | Part-time | |
|---|---|---|---|
| Applications | 1,591 | 1,381 | 210 |
| Accepted | 752 | 626 | 126 |
| Class Size | 257 | 184 | 73 |
| Age Range | 19-46 | 19-46 | 20-45 |
| Median Age | 24 | 24 | 27 |
| GPA | Combined | Full-time | Part-time |
|---|---|---|---|
| 75th Percentile | 3.73 | 3.77 | 3.58 |
| Median | 3.51 | 3.55 | 3.32 |
| 25th Percentile | 3.17 | 3.27 | 2.83 |
| LSAT | Combined | Full-time | Part-time |
|---|---|---|---|
| 75th Percentile | 161 | 161 | 160 |
| Median | 157 | 157 | 156 |
| 25th Percentile | 154 | 154 | 153 |
| Demographics of Class | Combined |
|---|---|
| Ethnic/Racial Diversity | 53% |
| Women | 53% |
| First Generation | 35% |
| LGBTQ+ | 22% |
| Military | 2% |
| Geographic Diversity | 7% |
| Undergraduate Institutions | 93 |
| U.S. States Represented | 10 |
| Foreign Countries Represented | 4 |
1 Note: Data as of Aug. 17, 2026
Questions?
McGeorge Admissions
Email | 916.739.7105